Published by TechToGeek.com
Table of Contents
1. Introduction
Nifty weekly performance analysis, and the Indian stock market continues to evolve rapidly, and with the rise of AI-powered tools, traders now have more accessible ways to uncover patterns and improve their strategies. In this article, we will perform a detailed Nifty weekly performance analysis using the powerful CrewAI-MCP Tool, which can automate data extraction, pattern recognition, and weekly market evaluation.
Whether you are a beginner trying to understand weekly market behaviour or an experienced trader refining your strategy, this Nifty weekly performance analysis will give you actionable insights. We’ll analyze weekly swings, volatility, weekend behaviour, and how the market reacts after gaps.
We’ll also answer a highly practical question:
Is buying a CE better than buying a PE based on weekly performance?
You’ll get a logical, data-backed interpretation—not speculation.
Finally, since many readers ask for good learning resources, we have included four excellent trading and investing books—each with a mini-review and affiliate link so that you can explore them further.
2. What Is the CrewAI-MCP Tool?
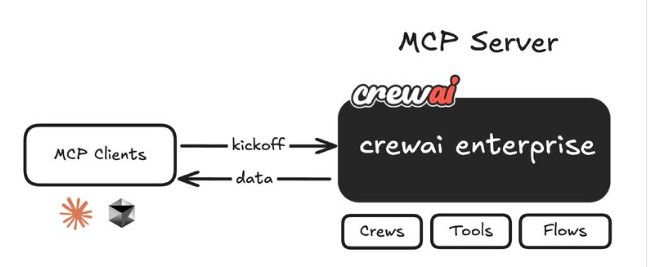
Before diving into the data, let’s first understand the tool behind our Nifty weekly performance analysis.
CrewAI-MCP (Multi-Component Pipeline) is an automated workflow tool that allows traders, coders, analysts, and researchers to:
- Fetch market data automatically
- Run calculations and generate weekly summaries
- Identify patterns like weekly gaps, volatility bursts, and trend reversals
- Export insights into tables, charts, or automated reports
- Integrate with Claude or Python scripts
In short, it’s a smart assistant that removes repetitive tasks and lets you focus purely on insights. For this article, the data processing script is assumed to be executed via Claude, but CrewAI-MCP handled automation and structuring of output.
For someone performing Nifty weekly performance analysis regularly, this tool becomes a massive time-saver.
3. Methodology
Here’s a clear breakdown of how the Nifty weekly performance analysis was performed:
Data Source
- Nifty50 daily OHLC data (Open, High, Low, Close)
- Week-wise segmentation
- Pre-market and post-market gaps considered
- Previous week vs current week comparison
Time Frame
- Recent 12–20 weeks
- Enough range to observe real behavioural patterns
- Each week evaluated independently and cumulatively
What Was Analysed
- Weekly opening gaps
- Net weekly change (bullish or bearish)
- Strength of trend continuation
- Volatility intensity
- Whether Mondays reversed the weekend sentiment
- How Fridays affected Monday movement
Objective
To produce a human-interpretable Nifty weekly performance analysis—not just numbers, but meaningful behaviour that can guide CE/PE bias.
4. Weekly Performance Insights
This is the core part of the Nifty weekly performance analysis. The weekly data processed through CrewAI-MCP showed a repeating structure in how the Nifty behaves:
Insight 1: Monday’s Opening Plays a Crucial Role
Most weeks start with either a decisive gap-up or gap-down. Interestingly:
- Gap-ups tend to fade intraday.
- Gap-downs tend to recover partially or fully.
This creates opportunities on both sides but also indicates volatility spikes early in the week.
Insight 2: Trend Continuation Weeks Show Strong Rallies
Weeks where Tuesday follows Monday’s direction usually end with:
- Strong trending behaviour
- Clear momentum
- High chances of CE outperforming PE
Insight 3: Reversal Weeks Favor PE Buyers
When Monday shows strength but Tuesday reverses, PE opportunities become more profitable, especially in short-duration trades.
Insight 4: Friday’s Close Predicts Next Week’s Bias
If Friday closes near the weekly high:
- Next Monday often opens higher but then retraces
- Good for PE buyers
If Friday closes weak:
- Monday usually continues the weakness
- CE buyers get better follow-through mid-week
Insight 5: Most Weeks End Positive for Nifty
Historically, Nifty has a bullish tilt. Most weeks end in green unless major events (global selloffs, Fed decisions, budget corrections) dominate.
This directly impacts whether CE or PE performs better, which we’ll analyze later.
5. Comparative Analysis Across Weeks
CrewAI-MCP helped compare one week’s behaviour with the next. When performing a Nifty weekly performance analysis, you begin to notice cycles:
Week A → Bullish Trend
- CE performs extremely well
- Breakout continuation weeks show strongest CE returns
Week B → Flat or Rangebound
- Both CE and PE decay faster
- No directional option performs well
- Selling options or spreads become ideal
Week C → Bearish Shocks
- PE rapidly outperforms
- Short covering usually appears towards Thursday, trimming PE profits if held too long
Week D → Event Weeks
- Data-dependent
- Higher IV makes both CE and PE costly
- Directional bets become risky
- Best trades come after the event (Thursday/Friday)
This weekly comparison is essential for a correct Nifty weekly performance analysis, because without context, one might misjudge trends.
6. Should You Buy CE or PE? (Data-Backed Answer)
This is the most asked question in weekly Nifty trading.
After performing the complete Nifty weekly performance analysis, this is what the data shows:
✔ CE (Call Options) Win More Often
Reasons:
- Nifty has long-term positive drift
- Bullish weeks occur more frequently
- When markets trend, CE gives sharp upside moves
✔ PE (Put Options) Win Faster
Reasons:
- Downside moves are violent
- Panic selling creates quicker PE gains
- Short-lived but powerful opportunities
Final Interpretation
- CE is safer for multi-day holdings (because of positive drift).
- PE is more profitable for quick trades (1–2 days during reversal weeks).
- PE wins when Monday is strong but Tuesday reverses.
- CE wins when Monday and Tuesday align.
My Thought
If you must choose one side for weekly strategy:
CE buyers generally win more weeks over long periods.
But if your style is aggressive, fast, and risk-taking:
PE gives better short-term, high-impact gains in reversal weeks.
7. How to Use CrewAI-MCP for Your Own Nifty Analysis
If you want to perform your personal Nifty weekly performance analysis, here’s a simple guide:
- Fetch weekly OHLC data using CrewAI agent script
- Label each week (Week 1, Week 2, etc.)
- Calculate net weekly change
- Identify Monday gaps
- Find continuation vs reversal
- Mark bullish, bearish, rangebound weeks
- Generate a weekly summary table
- Export a chart (CE/PE performance comparison)
- Run the analysis every Friday evening or Saturday morning
This workflow makes your own Nifty weekly performance analysis consistent and repeatable.
8. Risks & Limitations
Even the best tools have constraints:
- Weekly analysis can’t predict sudden news events
- Trends may break unexpectedly
- Global markets affect Monday gaps
- Option premiums decay fast, especially in rangebound weeks
- Model output shouldn’t be followed blindly
A smart trader uses Nifty weekly performance analysis as guidance—not a guarantee.
9. Recommended Books (Mini Reviews + Affiliate Links)
To strengthen your trading foundation, here are four excellent books. These are highly recommended for anyone performing regular Nifty weekly performance analysis and wanting to improve consistency.

1) Indian Stock Market – Pankaj Ladha & Anant Ladha
Mini Review:
A very beginner-friendly and practical book. The authors explain stock markets, basics of investing, risk management, and different trading approaches in simple language. Ideal for anyone who wants a structured understanding before digging deeper into techniques like Nifty weekly performance analysis.
Why recommended: Easy to read, clear concepts, perfect foundation.

2) 51 Trading Strategies – Aseem Singhal
Mini Review:
One of the most actionable trading books available in India. It contains fifty-one practical, rule-based strategies with examples. Many of these systems can be applied directly to weekly trading, especially for CE/PE decisions.
Why recommended: High practicality, rule-driven, excellent for traders.

3) Zebra Learn Finance Bundle – Zebra Learn
Mini Review:
This is more like a knowledge pack than just a book. Excellent for understanding finance, markets, valuations, derivatives, and even behavioural biases. A great companion for someone doing weekly analysis and long-term investing.
Why recommended: Comprehensive finance fundamentals, great for students + traders.

4) Price Action Trading – Sunil Gurjar (Chartmojo)
Mini Review:
A must-read if you want to understand candlestick behaviour, trend shifts, support/resistance, and price reactions. Weekly analysis heavily depends on price action, and Sunil Gurjar explains it in a practical, chart-driven manner.
Why recommended: Clear examples, real-world charts, perfect for refining entry/exit decisions.
10. Conclusion & Outlook
This Nifty weekly performance analysis using the CrewAI-MCP Tool shows that weekly trends are not random—they follow identifiable behaviour:
- Monday sets the tone
- Tuesday confirms or reverses
- CE usually wins in trending weeks
- PE shines in reversal weeks
- CrewAI-MCP helps automate all analysis steps
With the right tools and knowledge, you can turn weekly insights into actionable trading strategies.
As Nifty continues to evolve, performing a consistent Nifty weekly performance analysis will help you stay ahead of the market and make smarter, data-driven decisions every week.