

📊 TechtoGeek.com · Intraday Trading 📅 April 2026⏱ 5 min read
Meet VRZ Detector — my personal market alert system that pings me on Telegram the moment price approaches a key zone.
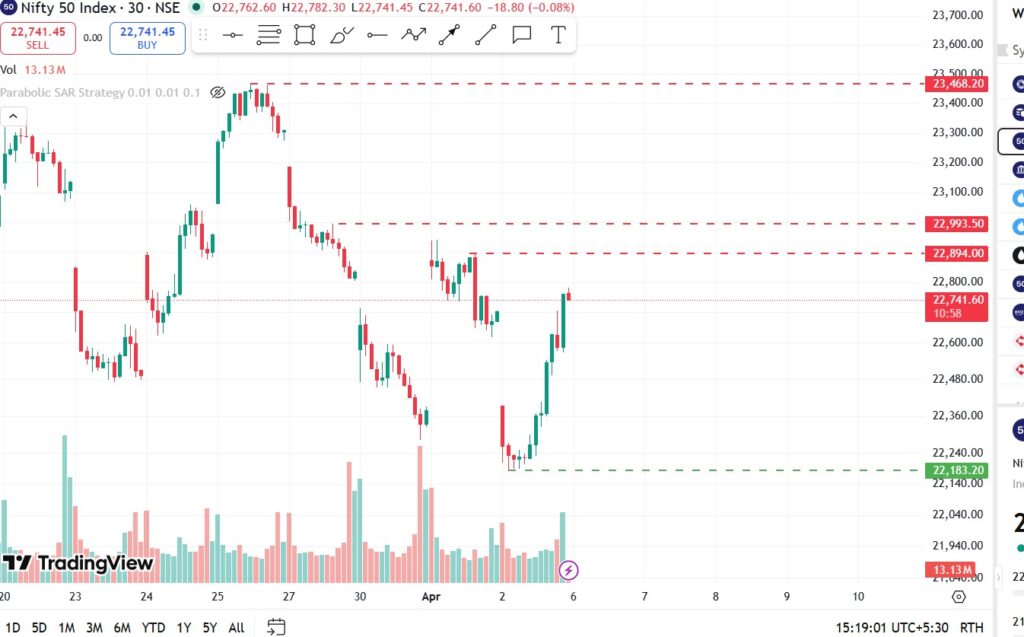
Nifty 50 30-min chart showing VRZ High and VRZ Low levels:
If you trade intraday like me,Myself and TradingView alone in my room :-), you know how mentally exhausting it gets — not the trades themselves, but the waiting. Staring at charts. Refreshing. Wondering if the level you marked at 7 AM still matters at 11 AM. That constant watch-duty drains you before the trade even shows up.
So I built something. I call it VRZ Detector. It’s not fancy, it’s not a recommendation engine, and it’s definitely not another indicator promising 95% accuracy. It’s a focused tool that does exactly one thing well — it watches the levels I care about, and tells me when price is getting close.
Table of Contents
01 · CONCEPT What Even Is a VRZ?
VRZ stands for Visible Reversal Zone — or at least that’s my personal interpretation of what these levels represent. On a 30-minute chart, certain price points tend to act like invisible walls. Price hits them, stalls, and often reverses. I mark these zones manually at the start of every trading day.
🔴 VRZ-High
22,894 – 22,993
Strong overhead resistance zone. When price approaches here, the odds favour a rejection downward. Trade idea: Sell CE (Call Options).
🟢 VRZ-Low
22,183
Key demand / support area. When price dips to this zone, a bounce upward becomes the higher-probability move. Trade idea: Sell PE (Put Options).
The chart above from April 2 shows exactly this — the red dashed lines around 22,894 and 22,993 held as resistance, while the green dashed line at 22,183 marked a clear bottom before a sharp recovery. These aren’t random numbers; they come from structural highs and lows spotted on the 30-minute timeframe.
02 · THE PROBLEM Marking Levels Is Easy. Watching Them Is Not.
Here’s the real issue I ran into. Once I mark a VRZ on the 30-minute chart, I actually need to monitor it on the 5-minute timeframe. That’s where the trade setup forms. That’s where I actually pull the trigger.
But I can’t sit and watch a chart all day. I have other work to do, other screens to attend to. Missing a level by just a few minutes means missing the trade entirely. I needed something that would tap me on the shoulder and say — “hey, that level you marked? Price is right there.”
Enter VRZ Detector. The rule is simple: if the 5-minute candle closes within ±5 points of any marked VRZ-High or VRZ-Low, I get a Telegram notification. Instantly.
03 · THE PRODUCT A Simple Tool with a Focused Purpose
VRZ Detector Landing Page
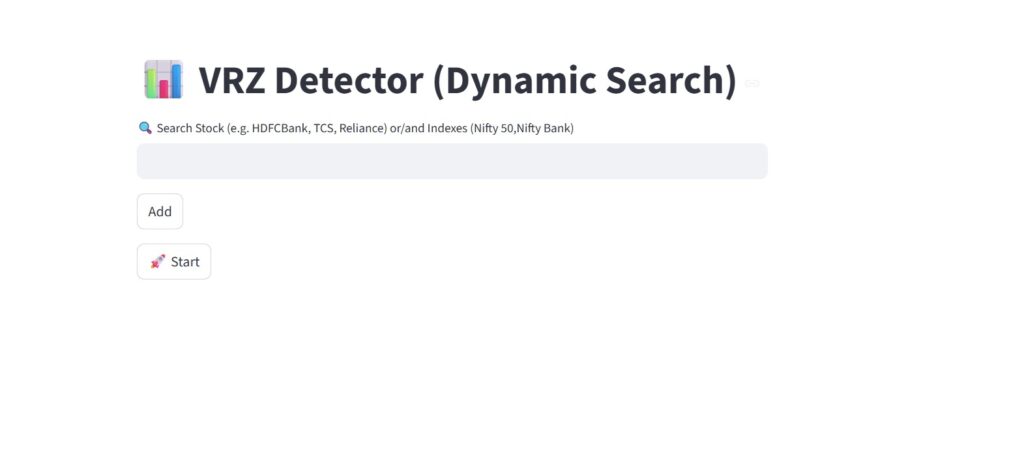
In this tool we can add Indexes and also stocks Eg:TCS
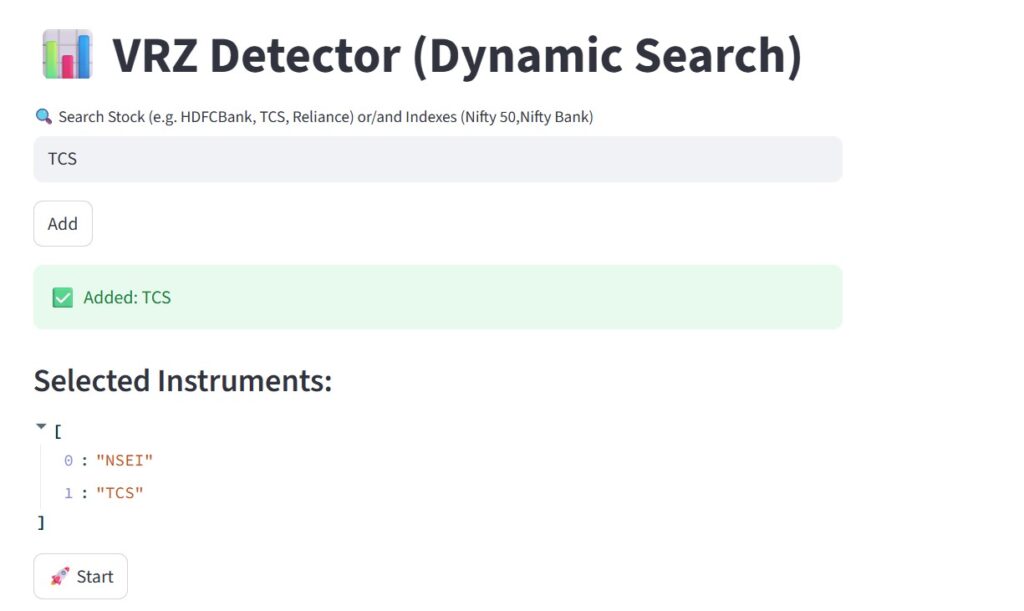
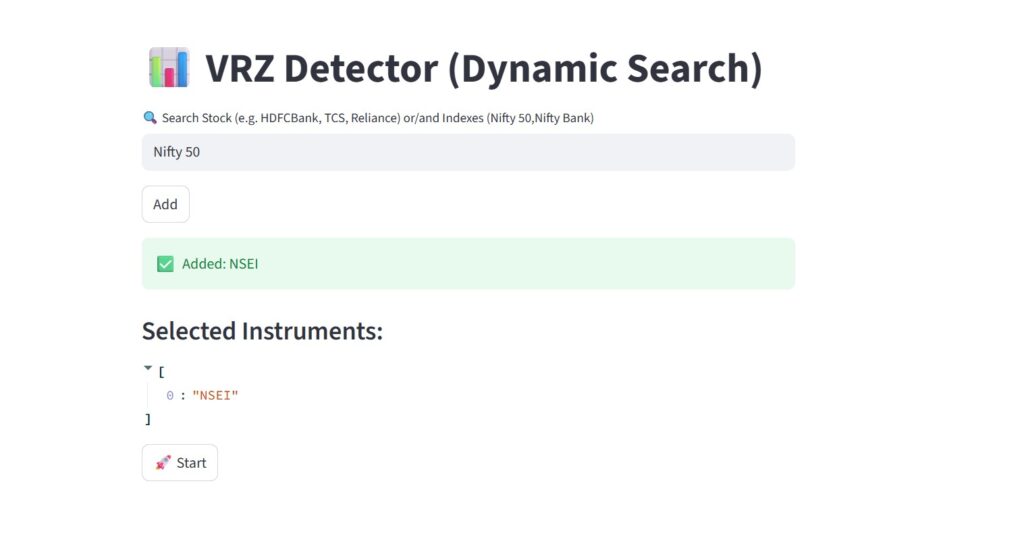
The UI is intentionally minimal. You type in the instrument — could be Nifty 50, Nifty Bank, or any NSE stock — add it to the list, and hit Start. The tool fetches the master data, identifies swing highs and lows on the 30-minute chart, and begins monitoring on the 5-minute frame.
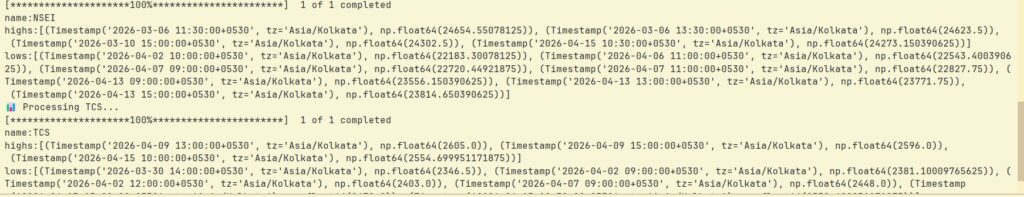
Once you hit start, the tool shows a live running status. It processes each instrument, extracts the significant highs and lows, and stores them for real-time comparison. No manual input of price levels required — the detection is automatic.
04 · WORKFLOW How It Works End-to-End
7:00 AM — Start the tool
Launch VRZ Detector. Type in your watchlist (e.g., Nifty 50, TCS, HDFCBank). Click Start.
Automatic level detection
The tool scans the 30-minute chart for structural highs and lows. These become your VRZ levels for the day.
Real-time monitoring begins
Every 5-minute candle close is compared against all stored VRZ levels. If price is within ±5 points — alert fires.
Telegram notification
You receive an instant alert: VRZ type (High/Low), exact level, and current price. You decide whether to trade.
You get on with your day
No chart watching needed. Only engage when the market comes to your level, not when you’re guessing.
05 · ALERTS The Telegram Bot in Act
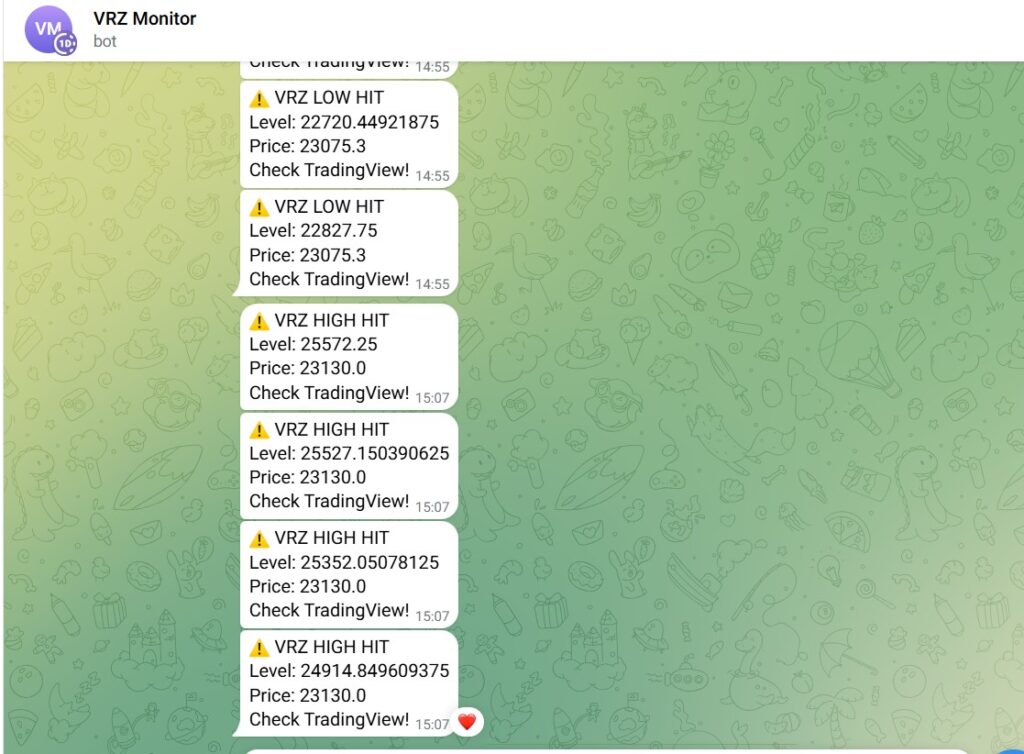
Here’s what a real alert looks like. Clean, fast, actionable.
⚠️ VRZ HIGH HIT
Level: 22,894.00
Price: 22,891.5
Check TradingView!
⚠️ VRZ LOW HIT
Level: 22,183.20
Price: 22,187.0
Check TradingView!
No noise. Just the level, the price, and a prompt to act.
06 · SCALE-UP500 Stocks. Same Logic. Zero Extra Effort.
📁 CSV Batch Mode
Load all 500 Nifty stocks at once via a simple CSV file. No typing each one manually.
⏱ 7 AM Start → 9 AM Free
Start the tool at 7 AM before market open. By 9 AM, all levels are detected and monitoring is live.
This is the part I’m genuinely proud of. Marking VRZ levels manually across 500 stocks would take two hours of solid work every single morning. With the CSV batch feature, I start the tool at 7 AM, and by the time market opens at 9:15, every stock in the Nifty 500 is already being watched.
I only get a notification when something actually matters — when price is knocking on a key level for one of those 500 instruments. That’s the kind of coverage no human can replicate by manually watching charts.
Which Feature Do You Find More Useful?
Let me know in the comments — your feedback shapes what I build next.
📈 Index monitoring — Nifty 50 / Nifty Bank VRZ alerts
📊 Nifty 500 stocks batch scanning via CSV
📱 Telegram real-time alert system
Drop your vote in the comments section below ⬇️
Interested in Collaborating?
If you found this article useful or want to explore building something together, I’d love to connect. Get in Touch → Contact Us
Thank you for reading · TechtoGeek.com